visualising-data-course
6: Tell a story
To build a relevent and insightful chart, imagine the reader asking these question. Does the chart provide any answers?
- So what?
- Why should I care?
- What’s the problem?
- How was it (will it be) solved?
- What must I do?
A good book on this is Storytelling with Data by Cole Nussbaumer Knaflic.
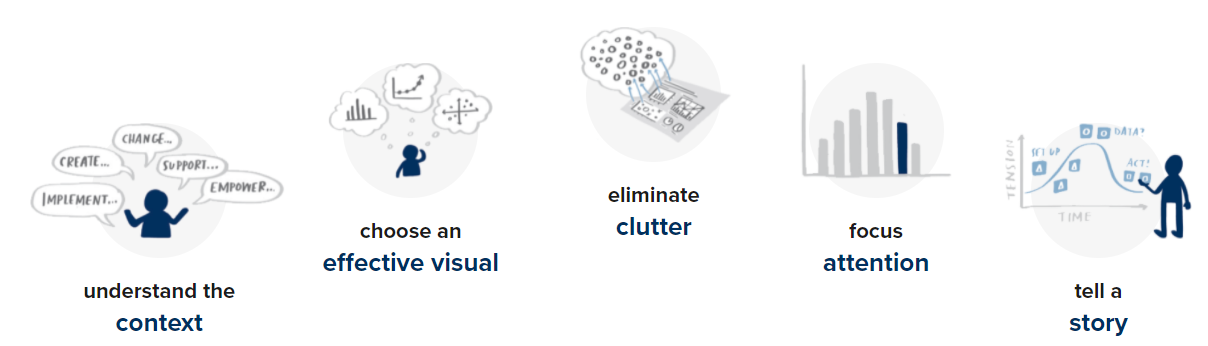
The author describes a process of five steps:
- understand the context
- choose an effective visual
- eliminate clutter
- focus attention
- tell a story
Source: Storytelling with Data