SEGRO Courses
Home | Excel | Power BI | Copilot | Visualising Data
Excel Models Golden Rules
- Separate inputs, calculations, results
- Never copy/paste a value. Always reference
- Simplify. Clarify. Check.
- Format cells and values for readability
- Make tabular results more appealing
- Include a documentation sheet
- Perform all calculations in the same units and at the same level
- Consistent and considered layout
- Use Excel tables for tabular data
- Design out any manual task done repeatedly
1. Separate inputs, calculations, results
For example, we can split the different sections of the model into different worksheets.
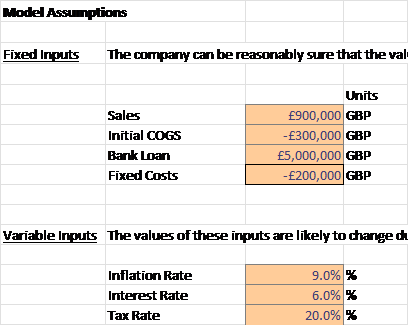
Assumptions worksheet
Separate calculations worksheet
2. Never copy/paste a value. Always reference
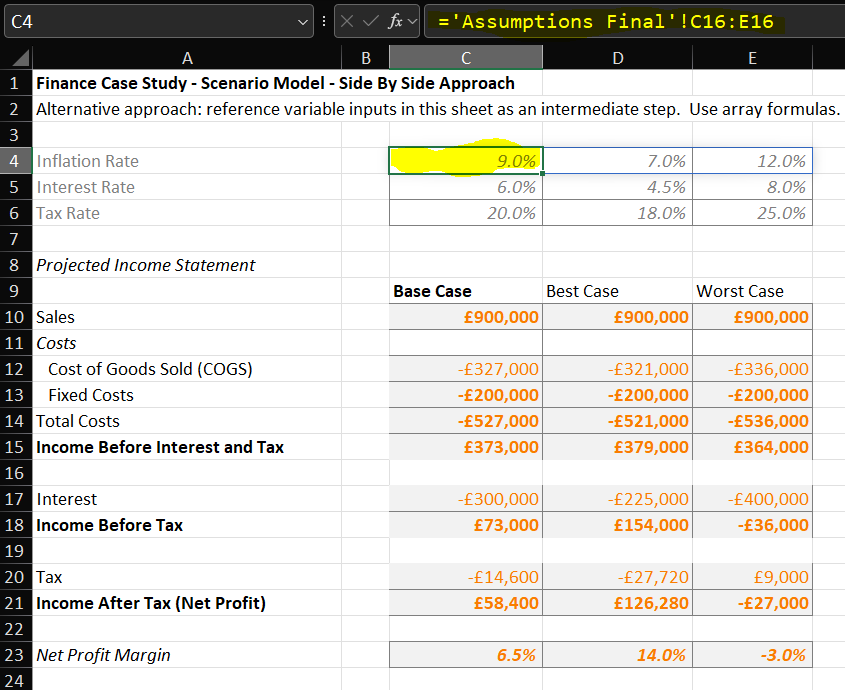
For example, the calculations at the top of the sheet reference values in another sheet (perhaps necessary since a later operation such as a data table requires all of its inputs on the same sheet)
3. Simplify. Clarify. Check
- Break complex calculations into several steps.
- Name objects (formulas, variables, tables, columns, pivots, ranges, tabs, files) well.
- Think about user data entry: add data validation, lock cells.
- Get peers to “mark your homework” at every step of the process
Use F2 to view the formula
Use Check Cells to check that a calculation is correct.
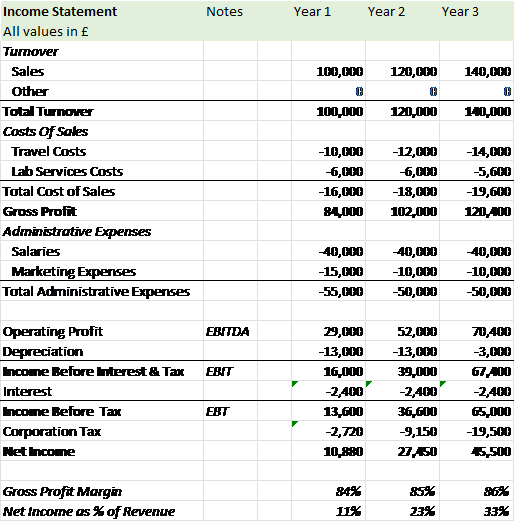
4. Format cells and values for readability
- Format numbers to be easily readable. e.g., 1,234,267 or 1.23M rather 1234567.89
- Format money with the appropriate currency unit e.g., £, €, $
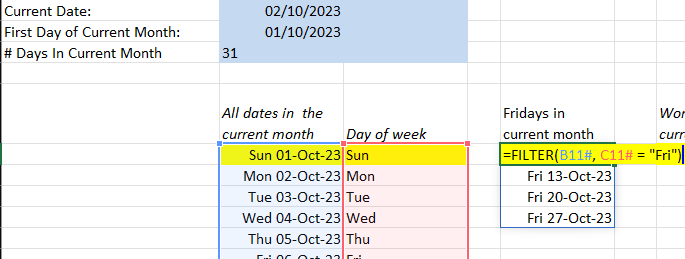
- Use region independent date formats e.g., 2022-09-05 rather than 09/05/2022, or format so no ambiguity 05-Sep-2022
- Apply cell styles based on their type - variable, calculation, check cell or result.
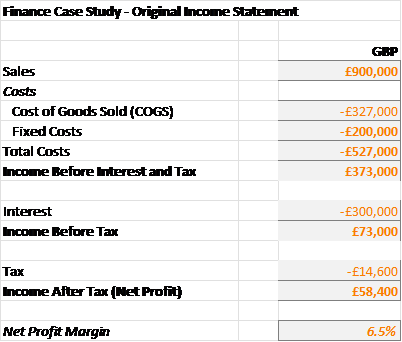
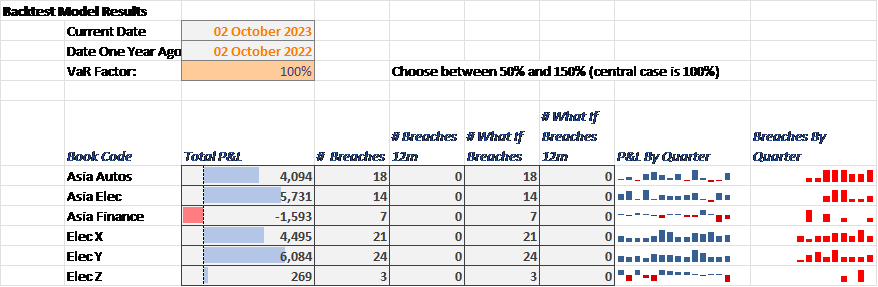
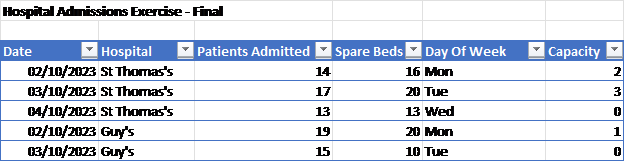
This sheet uses long date formats, sparklines and cell styles.
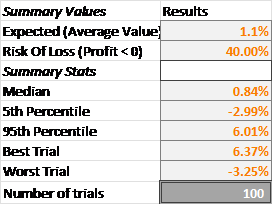
5. Make tabular results more appealing
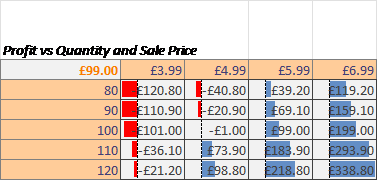
Use conditional formatting techniques such as data bars, background colours and icons.
Data bars show relative size (and whether positive or negative)
Background colours show normal and out-of-normal results (but choose colours carefully).
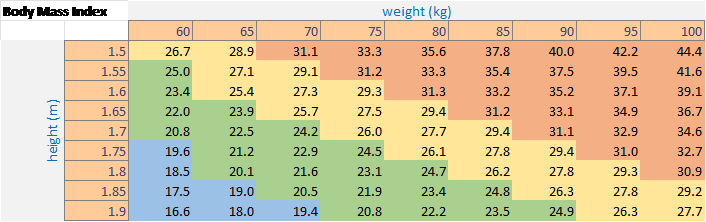
Icons highlight any outliers, and act as a call for action, for exception reporting.
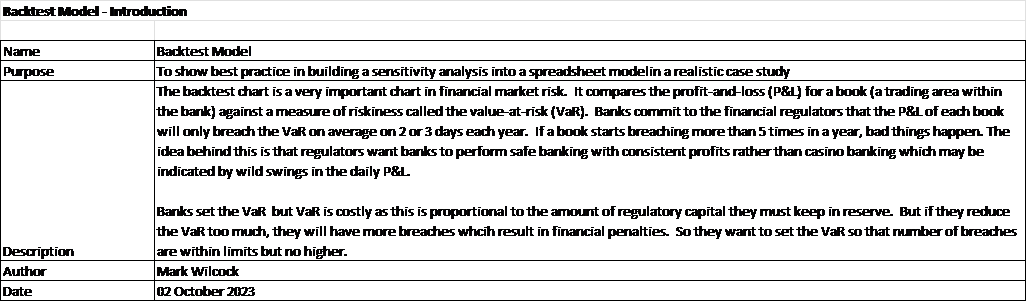
6. Include a documentation sheet
- Use for version history, author(s), contacts, intended use
- Document assumptions, formulas as closely as possible to their use
- Document key limitations and simplifications. e.g. Model will break if you try and extend it to more than five years.
7. Perform all calcs in same units and same level
Perform all calculations at the same unit granularity/precision, for example
- all in £, not some in €, some in $ and some in £
- all in metres3, not some in metres3 and some in hectares,
- all in real (inflation-adjusted) or all in nominal.
If you have input data at a different granularity, enter it in the source units, and convert immediately into your main model units, e.g. immediately convert € and $ to £
8. Consistent and considered layout
- One formula per row. For example, don’t put Cost and % Total Cost on same row
- One purpose for column: column C is Jan, Column D is Feb,… across all sheets
- Plan layout for data to expand. For example, functions that spill
8. Consistent and considered layout (continued): Read like a book
The spreadsheet should be read like a book; left to right, top to bottom.
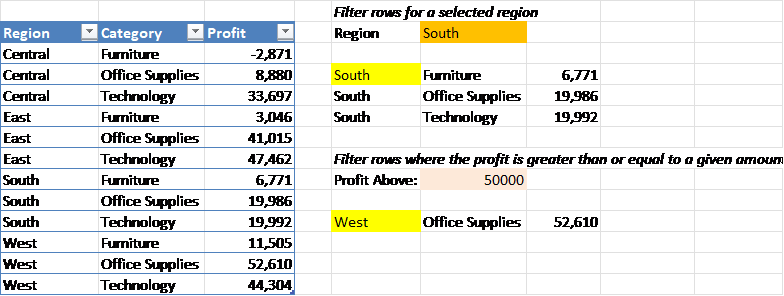
9. Use Excel tables for tabular data
These have many benefits such as readable and robust formulas.
It encourages us to organise our data into a tabular shape, note and correct any data quality issues. This leads to good analysis and visualisation.
10. Design out any manual task done repeatedly
Manual processes are error-prone: avoid if possible.
Typical manual process, and possible alternatives include:
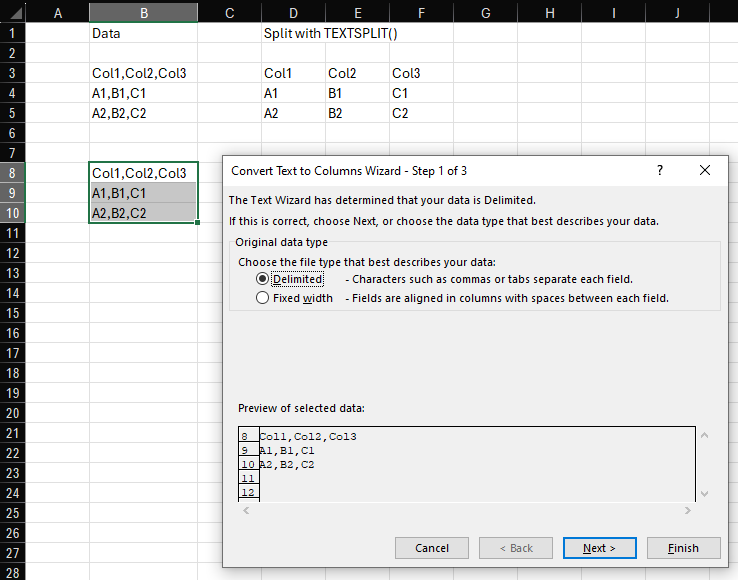
- Convert Text to table (Text To Columns)- use TEXTSPLIT() instead
- Remove Duplicate - use UNIQUE() instead
- Fill down a column of dates - use SEQUENCE() instead