SEGRO Courses
Home | Excel | Power BI | Copilot | Visualising Data
Effective Copilot - Exercise - Imagers
Copilot can generate, understand and interpret images. Imagers use Visual Creator to creates an image based on a text description, and to interpret images
Image Generation Tasks
Use Visual Creator. Create images or videos based on each of SEGRO’s three priorities.
- Championing low‑carbon growth – committed to environmental sustainability, including net-zero carbon goal by 2030.
- Investing in our local communities and environments – delivering economic and social benefits through community plans and partnerships.
- Nurturing talent – fostering inclusive culture, career development and employee wellbeing.
Image Interpretation Tasks
In the tasks below, assess Copilot’s capabilities to interpret images based on these criteria:
- image description: how well does it describe the scene, objects, and actions?
- object recognition: how well does it identify objects
- reading text and handwriting: how well does it transcribe printed or handwritten text
- diagram interpretation: can it understand a schematic diagram e.g. a map, a floor plan of a house
- chart understanding: can it understand and interpret a simple line or bar chart
- artwork analysis: can it analyse the style and historical context of a painting?
- logo and branding recognition: can it identify the company behind a logo or product packaging
- emotional interpretation: how well can it identify the emotions on people’s faces?
Interpret an image
This is an image of one of SEGRO’s properties, the East Midlands Gateway Logistics Park

Download here, upload to Copilot and then prompt Copilot to describe the attached image. Follow on with some more specific questions based on the original response.
Here are some example prompts. Use a separate prompt for each question below.
Describe the image.
Where is this building?
Who owns this building?
How did you conclude that SEGRO is the owner?
Follow with a really challenging question
Estimate the size of the building in square feet
Interpret a complex image
This photo is one of a carousel of images about SEGRO’s history at this page.
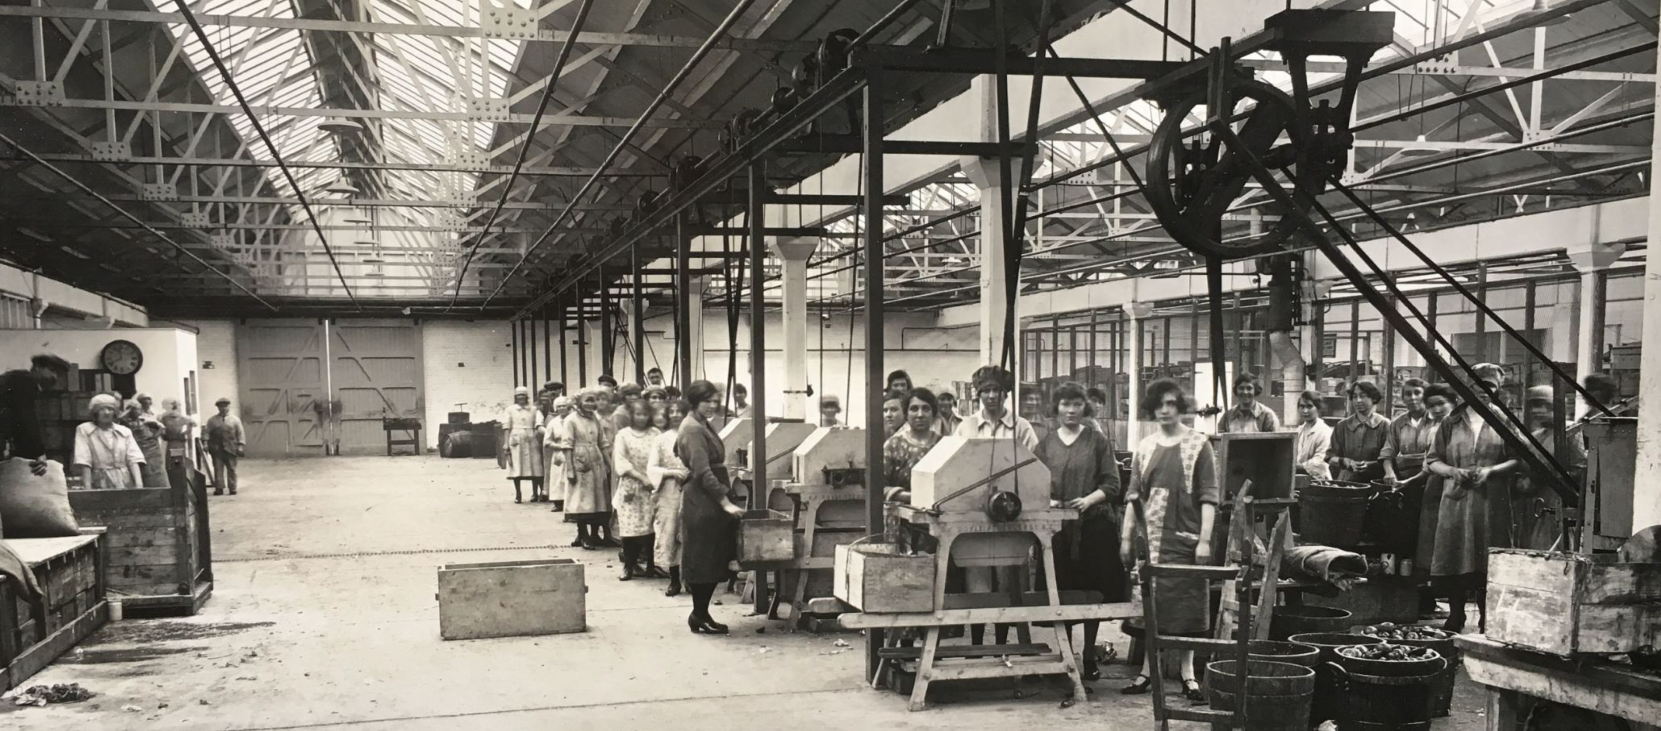
Download here, upload to Copilot and then prompt Copilot to describe the attached image. Follow on with some more specific questions based on the original response. See if Copilot reads the messages on the banners. If not, prompt it to do so.
Interpret an image with text
This image is from the SEGRO Learning and Development page.
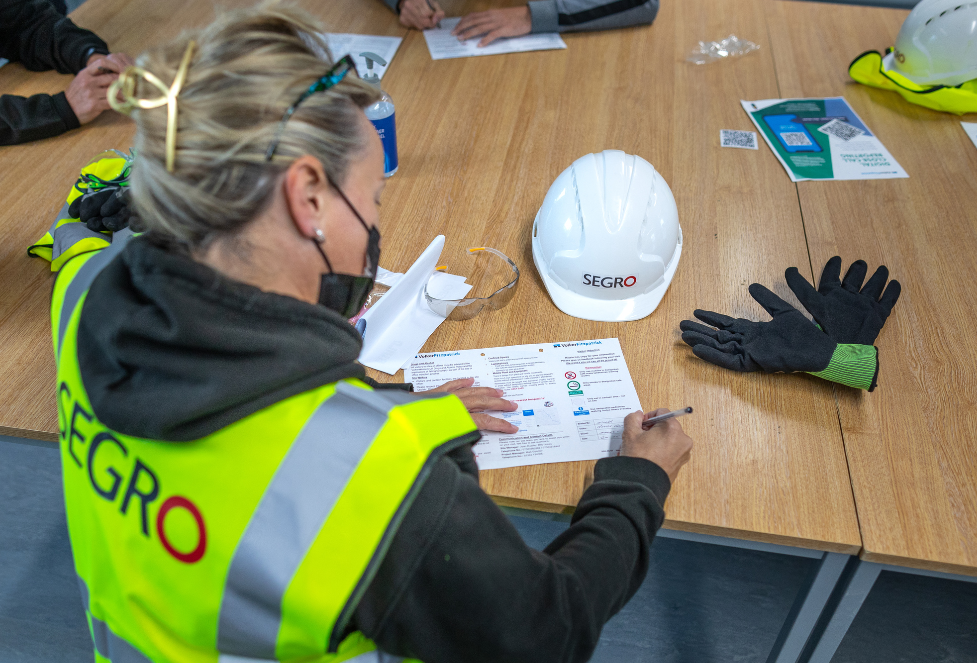
Download here and upload to Copilot and then prompt Copilot to describe the attached image. See if Copilot reads the text on the jacket and hat. If not, prompt it to do so.
This image, of an old SEGRO sign, provides a more challenging example of reading the text in a photo.
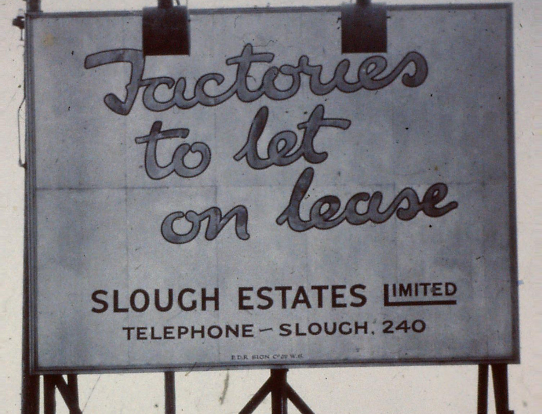
Download here.
Interpret a map
This is a map of SEGRO locations. It is from the SEGRO Properties Map.
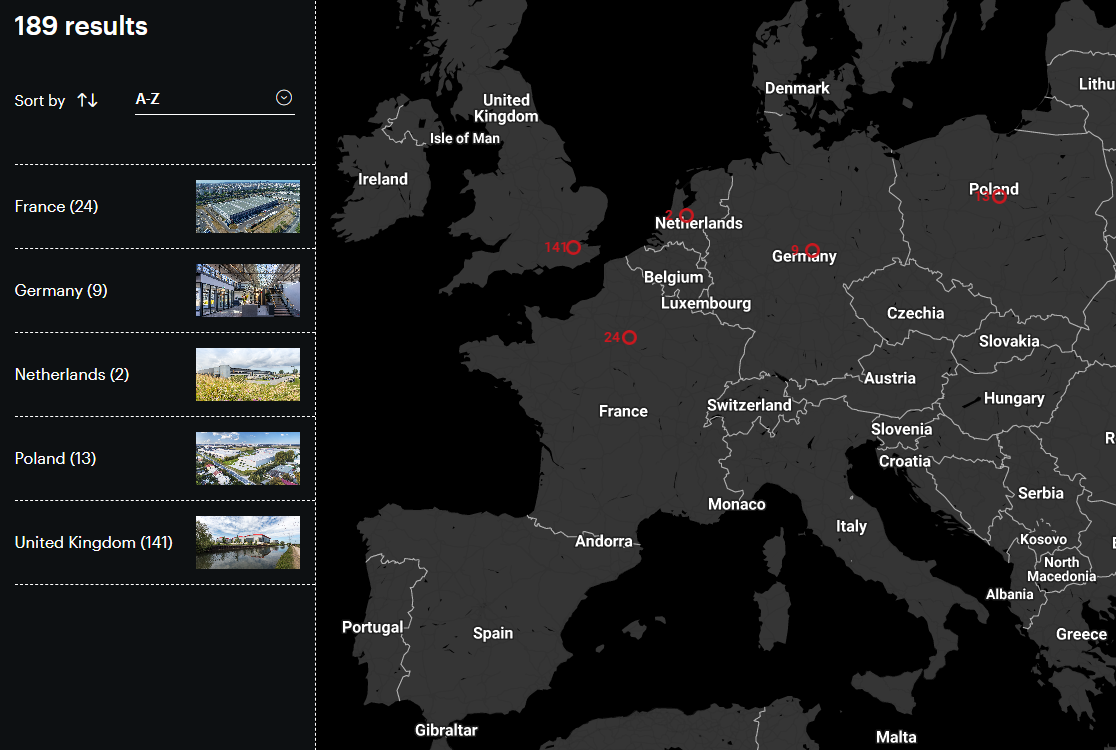
Download here, upload to Copilot and then prompt Copilot to describe the attached image.
Ask some specific questions in turn, for example:
Based on the map, list those countries where SEGRO has properties.
Which large countries in Europe do not have a SEGRO property?
How many SEGRO properties are in Poland?
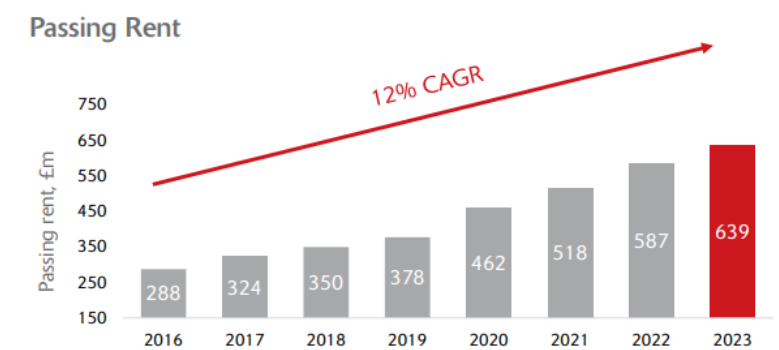
Interpret a chart
This chart shows the annual revenue from passing rent from 2016 to 2023. It is from the SEGRO Investment Case.
Download here, upload to Copilot and then prompt Copilot to describe the attached image.
Ask some specific questions starting with
In the following questions, refer to the attached chart.
How is SEGRO’s performance on passing rent over the last decade? Explain passing rent and the distinction between passing rent and usual definition of rent.
The image states “12% CAGR”. What does the abbreviation CAGR stand for? Is 12% a good value?
Ask questions about images of a person
Here are the images of the CEO and CFO of SEGRO.
David Sleath, CEO download here

Soumen Das, CFO download here

You can also find these on the SEGRO website media page here.
Provide these to Copilot and ask some questions such as:
Describe the person in this image.
How are they feeling?
Artwork Analysis
Here are three paintings from the National Gallery in London.
The Ambassadors download

Surprised! download

The Water Lily Pond download

Can Copilot describe, and analyse the style and historical context of these paintings?
Interpret an image of your choosing
Choose a variety of other images, import each into Copilot, and then cross-question the tool to see how well it can describe, interpret and infer from the image.